FUTURE VISION — NOT AVAILABLE TODAY — REQUIRES FURTHER RESEARCH
This section describes a concept under exploration, not a product or roadmap commitment.
No hardware has been designed, built, procured or tested. All components are shown as functional
categories; no vendor or part has been selected.
What exists, what comes next
Three stages, stated plainly
Most of this page describes a purpose-built appliance. That is the furthest stage, not the
first one — and it is the part we can least justify today. Read the hierarchy before the
hardware.
Available today
PRAQTOR QUANTUM external assessment
Thirteen detection engines, ninety rules — eighty evaluated against public sources and direct handshakes,
ten against captured internal traffic. Evaluated against public
evidence. Professional reports delivered as a service. In service now.
↓
Proposed version one
Software sensor on a customer SPAN port
A container or virtual machine on customer-provided hardware,
receiving mirrored traffic from an existing SPAN or mirror port. Analyses
TLS 1.2 and 1.3 over TCP. Retains metadata and aggregates only.
No hardware required — no enclosure, no data diode, no TAP, no validated storage,
no 100-gigabit capture.
↓
Future assurance configuration
Purpose-built appliance with a data-diode TAP
Physically receive-only capture, measured boot, validated encrypted
storage, tamper-evident enclosure. Concept only — not designed, built, procured or
tested. Everything below on this page describes this stage.
Version one exists to answer one question: does observed internal
cryptographic behaviour make the assessment materially more useful than the external scan alone?
Nothing beyond that question needs to be true yet.
How it fits
You deploy the sensor. We deliver the report.
PRAQTOR QUANTUM is a service. We scan your domains with thirteen detection engines and ninety rules (eighty external, ten for captured internal traffic),
and we deliver professional reports. Everything we measure today is external — what
your organization exposes to the internet.
That view stops at the perimeter. It cannot tell you what your own internal systems are actually
negotiating: whether your service mesh is on hybrid post-quantum key exchange or still on classical
elliptic curve, whether the database connections a team upgraded last quarter really changed, or
whether there are internal services running TLS every day that appear in no inventory you have.
The Internal Network Sensor answers those questions and sends the answers back to us,
so the reports you already receive get better.
◀ SCROLL HORIZONTALLY IF TRUNCATED ▶
Fig. 1 — Service flow. The sensor collects; the platform analyses; the report is the product.
What this is not
Not a standalone scanner. We do the scanning. The sensor collects one additional
stream of evidence and sends it to us.
Not a replacement for the service. It enhances it. The external assessment remains
the basis of what we deliver — it is what tells you what your partners, regulators and adversaries can see.
Not a hardware security module. It performs no cryptography. It observes other
parties' cryptography.
Not a firewall. It is never inline and blocks nothing. It cannot affect production
traffic, because production traffic does not pass through it.
What the enhanced report can say
Today — external only
With the sensor — external plus internal
“Your public endpoints do not offer post-quantum key exchange.”
“…and 94% of measurable internal handshakes are still negotiating classical key exchange — coverage: 81% of observed connections.”
“Certificate X uses RSA-2048.”
“…and that service carries 40% of observed internal TLS connections.”
“These are the domains we can see.”
“…and here are eleven internal services running TLS that appear in no inventory you gave us.”
A point-in-time posture score.
An adoption curve — measured, not reported by a change ticket.
“Your migration program is documented as underway.”
“…and measurable internal handshakes show movement from 3% to 21% over the last quarter, at consistent coverage.”
The difference between believing a service was migrated and
observing that its traffic changed is the whole value of the sensor.
What it captures
Handshake metadata, and nothing else
Every TLS connection begins with a negotiation in the clear: the client says what cryptography it
supports, the server says what it chose. The sensor reads that negotiation and nothing after it.
TLS handshake — ClientHello
The offered protocol versions, cipher suites, key exchange groups, key shares and
signature algorithms. This is the intent signal — what the client is prepared to use.
→ what your clients are ready for
TLS handshake — server selection
The negotiated version and selected cipher suite. In TLS 1.3 the
ServerHello also carries the selected key exchange group. In TLS 1.2 the negotiated
key exchange lives further into the handshake — see the parser scope below.
→ what actually happened
Key exchange algorithms
Whether a connection used post-quantum or hybrid key exchange such as an ML-KEM
combination, classical ECDHE, or legacy RSA key transport. This is the primary measurement
and the reason the device exists.
→ ML-KEM? ECDHE? RSA?
Certificate metadata
Signature algorithm, key size, issuer and validity — where the certificate is
visible in the clear. In TLS 1.3 the certificate is encrypted, so this comes from TLS 1.2 sessions
or from our external scan, and is always labelled with which.
→ algorithm, key size, issuer
Cipher suite negotiation
What each client offered and what the server selected from that offer, in observed
sessions. Repeated observations show the cryptography actually in use across the estate.
→ offered vs selected, in real sessions
Endpoint relationships
Observed TLS endpoint relationships by address and port, with counts and timing,
enriched to named services where attribution evidence is available. Service topology — not user
activity.
→ which endpoints talk to which
Measurement coverage
What proportion of observed connections were classifiable at all. Resumed
sessions carry no key share, and some traffic is not attributable to a named service.
Coverage is reported alongside every adoption figure, never omitted.
→ the denominator, stated
Post-quantum adoption over time
The proportion of full handshakes using post-quantum key exchange, broken down by
service, by segment and by time. The number an executive or a regulator asks for, and the hardest
one to produce any other way.
→ the adoption curve
Does not capture
Payload data — no application data of any kind
Decrypted content — it holds no keys and decrypts nothing
Application-layer user data — no request bodies, responses, files or messages
User credentials — no passwords, tokens or application authentication material
Authentication-adjacent handshake fields — pre-shared-key identities, session
tickets, binders, cookies and client-certificate identity are explicitly discarded by the parser
Raw packet export — there is no capture download; the interface offers measurements only
A precise statement about payload
A tap delivers frames to the sensor's network interface, and those frames physically pass through
the receive path. That is how packet capture works, and any claim to the contrary would be wrong.
What is true, and what matters:
Application payload is never retained. Frames are filtered at the earliest point in the
capture path, handshake fields are extracted, and everything else is discarded before anything reaches
storage. Payload is never written to disk and is never sent to the PRAQTOR QUANTUM platform.
Connection metadata is retained — stated precisely
The sensor does keep connection metadata, and some of it is identifying in the ordinary
sense: source and destination addresses, ports, timestamps, and the server name indication where it is
present. Server name indication is kept deliberately — it is how a measurement is attributed to a
named service rather than to a bare address.
No application-layer user data and no user credentials are retained. Connection metadata,
including server name indication, is retained as part of the service identity record.
Client addresses can be pseudonymized on request — 10.10.44.73 becomes
endpoint-a7f29 — preserving the ability to count repeated endpoint behaviour without
persisting a directly usable internal workstation address.
What the parser reads, by protocol version
Two messages are enough in TLS 1.3. They are not enough in TLS 1.2, where the
negotiated key exchange parameters live further into the handshake — all still in the clear, before
encryption begins.
Protocol
Messages read
What it yields
TLS 1.3
ClientHello
Offered versions, cipher suites, key exchange groups, key shares, signature algorithms, application protocol, server name
TLS 1.3
ServerHello
Negotiated version, selected cipher suite, and the selected key exchange group
TLS 1.2
ClientHello
Offered versions, cipher suites, named curves, signature algorithms, application protocol, server name
TLS 1.2
ServerHello
Negotiated version and selected cipher suite
TLS 1.2
Certificate
Chain composition, signature algorithm, key size, issuer — in the clear in TLS 1.2
TLS 1.2
ServerKeyExchange
The named curve and ephemeral parameters — where the negotiated key exchange actually lives in TLS 1.2
Every percentage comes with its coverage
Not every connection is classifiable. A resumed session carries no key share, so no negotiated group
is observable. Some traffic cannot be attributed to a named service. An adoption figure without a
denominator would be quietly wrong, so the denominator is always published:
42% of observed full handshakes used ML-KEM coverage: 78% of observed
connections were classifiable full handshakes
What passive observation cannot tell you
If a client offers AES-256 and AES-128 and the server selects AES-256, the sensor knows exactly two
things: what that client offered, and what the server chose from that offer. It knows nothing about
whether the same server would accept a legacy cipher that no observed client happened to offer.
Enumerating what a server is willing to accept requires actively probing it with different
offers — which is what the external assessment does. The sensor reports the cryptography
actually in use; the external scan remains responsible for server capability. The two streams are
complementary, not redundant.
Components
What the sensor is made of
Each component exists to serve one of two goals: capture the handshake without dropping it,
or make the collection boundary something a network owner can verify rather than trust.
Where a real product has been researched, it is named below with its specifications and a link, so the
concept can be checked against something that actually exists. Naming is not selecting.
Every product shown is a reference point for form factor, capability and sourcing — nothing has been
procured, quoted, tested or endorsed.
How to read the product references
Product shown for reference only. No vendor has been selected, and no organization named here
has reviewed or endorsed this concept.
Specifications quoted below were checked against the vendor's own published pages on 27 August 2026.
Where a vendor page and a third-party source disagree, the vendor page wins and the difference is noted.
Where a specification could not be verified, it is not stated.
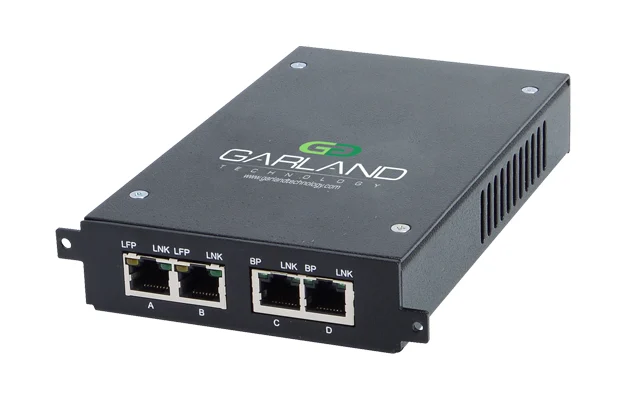
GARLAND TECHNOLOGY · P1GCC SERIES COPPER TAP
Component A · Collection
Network TAP
The physical device that copies traffic from a live link and sends the copy
to a monitor port.
Type · Passive optical or copper, data-diode variant
Attribution: the "made in the USA" wording is
Garland’s own, on the product page. The TAA claim comes from the Carahsoft federal listing, which
describes a "TAA compliant network visibility portfolio" available on GSA, SEWP and ITES-SW2.
Product shown for reference only. No vendor has been selected, and no organization named here has reviewed or endorsed this concept.
Why it mattersIn a data-diode TAP there is no physical connection
between the monitor port and the network ports. Data goes one way because there is no wire going
the other way — not because something is configured. An auditor can verify that by looking at it.
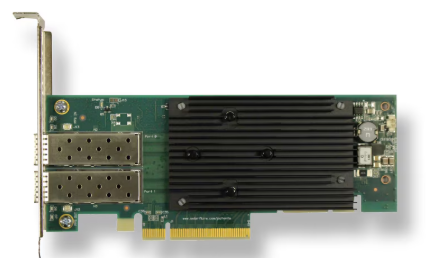
AMD SOLARFLARE · X2522 DUAL-PORT SFP28
Component B · Collection
Receive-only interface
The network card that only listens — it receives the copied traffic and
cannot send anything back.
The Solarflare part is worth its cost only
where nanosecond timestamping is genuinely wanted. For a handshake-only workload an Intel X710 is
sufficient and easier to source. Intel is US-headquartered, but country of manufacture varies by SKU
and must be checked before quoting to a federal customer.
Product shown for reference only. No vendor has been selected, and no organization named here has reviewed or endorsed this concept.
Why it mattersOn an optical link the transmit fibre is simply not fitted,
so the interface cannot transmit because there is nothing to transmit into. Note the honest limit:
on copper gigabit this is not possible — the link needs both ends signalling — so copper
deployments rely on configuration, and we say so.
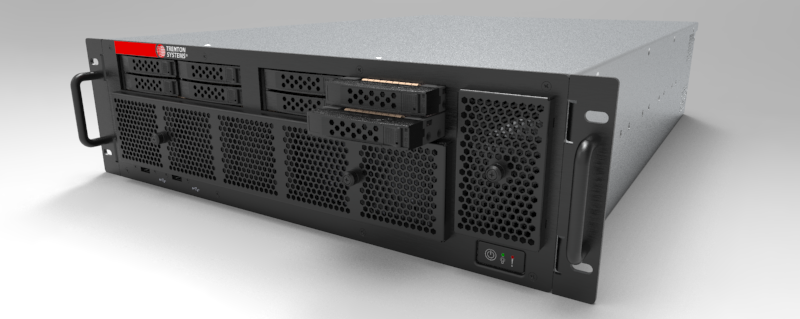
TRENTON SYSTEMS · BAM RUGGED RACK SERVER
Component C · Processing
Compute module
The embedded processor that runs the capture engine and drives the parser.
Class · Fanless embedded x86, 8–16 cores
Memory · 32–128 GB
Cooling · Passive, no moving parts
Capture stack · Kernel-hook early filtering
Sourcing · US-designed and manufactured options exist
Researched reference — primary
Trenton Systems — rugged rack servers
Location · Atlanta, GA headquarters
Vendor wording · "Designed, manufactured, assembled, tested, and supported in the USA"
Form factors · 1U available — 3PI series (1U/2U/3U) and 1U multi-node
Why them · vetted supply chain; the buyer profile is exactly theirs
Cited for the physical envelope only —
a fanless 1U server that fits a wiring closet. Its onboard networking is gigabit, so a capture NIC
(Component B) would be added by expansion rather than used from the board. An earlier draft of this
page described it as having dual 10 GbE; the vendor page does not, and the claim has been corrected.
Product shown for reference only. No vendor has been selected, and no organization named here has reviewed or endorsed this concept.
Why it mattersTwo things scale differently. Analysis is light —
parsing a handshake is microseconds. Capture must keep up with the segment's packet rate,
because a handshake frame dropped here is a measurement that never happens. The module is sized by
capture, not by analysis — and fanless because this box may live in a wiring closet or an
industrial cell.
SOFTWARE · RUNS ON THE COMPUTE MODULE
Component D · Processing
Handshake parser
The software that reads the TLS negotiation and extracts the cryptographic
parameters, discarding everything else.
Extracts · versions, suites, groups, key shares, sig algs
Reassembly · Bounded, across packet boundaries
Scope v1 · TLS 1.2 / 1.3 over TCP
Output · Compact measurement records
Runs on · Component C, the compute module — no separate hardware
Not a purchasable component
Software — written by us, running on the compute module
There is no vendor and no part number here. This is the one
component in the sensor that is entirely ours, and it is also the one that carries the measurement
quality: what it parses, what it discards, and what it refuses to infer determines whether the report
is trustworthy.
Why it mattersTwo shortcuts are tempting and both are wrong. "Grab the
first packet of each flow" fails because a ClientHello can span several packets, and post-quantum
key shares make large ClientHellos more common. "ClientHello plus ServerHello is enough"
fails in TLS 1.2, where the negotiated key exchange is carried in ServerKeyExchange. The parser
reassembles enough to read the whole negotiation, with a hard bound so flow state cannot grow
without limit — and detects TLS by record content rather than by port, since internal databases
and service meshes routinely run TLS off 443.
SELF-ENCRYPTING NVMe · NO PRODUCT SELECTED
Component E · Storage
Encrypted storage
Where measurement records are held locally, and where they buffer if the
management link goes down.
Type · Self-encrypting NVMe, M.2 or 2.5"
Capacity · Set by the detailed-window policy — to be sized on benchmark
Encryption · Hardware, with pre-boot authentication
Certification · FIPS-validated options available
Retention · Short detailed window, then aggregates
Researched reference
DIGISTOR Citadel K-Series — DIG-M2N2100032-K03
Capacity · 1 TB · Form factor · M.2 2280
Interface · PCIe NVMe
Encryption · self-encrypting drive with pre-boot authentication
NIAP · VID #11297 · CSfC · component-list entry for hardware full drive encryption
TAA compliantLegacy line — not in current DIGISTOR lineupNo FIPS 140-3 validation found
Cited for its capabilities and form
factor, not as a selection. Two things a buyer should know: the Citadel K-Series no longer appears
in DIGISTOR’s current lineup, and DIGISTOR’s published validations for these drives are FIPS 140-2 —
all remaining FIPS 140-2 validations move to the CMVP Historical list on 21 September 2026,
after which NIST advises federal agencies not to include them in new procurements.
Requirement, not a part: the storage
device must carry an active FIPS 140-3 CMVP validation at the time of procurement,
verified against the CMVP validated-modules list rather than against vendor marketing or any part
number recorded here.
Product shown for reference only. No vendor has been selected, and no organization named here has reviewed or endorsed this concept.
Why it mattersHandshake metadata is sensitive in its own right. It
enumerates internal hostnames, service topology and precisely which services are cryptographically
weak — effectively a prioritized target list. Encryption at rest is not a checkbox here.
Retention is deliberately two-stage: detailed per-handshake records live for a short configurable
window, and long-term reporting uses aggregated counts per service per time bucket. That is better
for privacy and for storage at once — and it matches what the report needs, since adoption curves
are aggregates rather than individual connection rows.
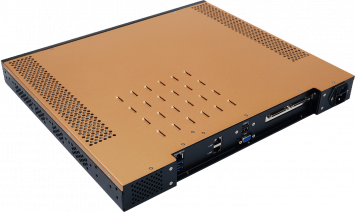
TRENTON SYSTEMS · RUGGED CHASSIS REFERENCE
Component F · Physical
Tamper-evident enclosure
The physical box, built so that anyone who opens it leaves evidence that
they did.
Form factor · 1U rack, or compact fanless desktop
Tamper · Evident seals plus chassis intrusion switch
Boot · Signed and measured boot chain
Firmware · Protect, detect and recover
Reporting · Intrusion events sent to the platform
No vendor identified yet
US-sourced integration options exist
Trenton Systems · Atlanta, GA · designed and manufactured in the USA
Crystal Group · Hiawatha, IA · US-made rugged rack and embedded systems
The enclosure is most likely delivered as part
of an integrated build rather than bought separately, which is why no standalone product is named. The
economics favour a validated module — the encrypting drive — inside a tamper-evident
chassis, rather than certifying an entire chassis.
Product shown for reference only. No vendor has been selected, and no organization named here has reviewed or endorsed this concept.
Why it mattersThis unit sits in a customer's rack for months or years,
which makes it a far more attractive persistence target than a tool that lives in a case.
Certifying an entire chassis is dramatically more expensive than putting a validated module — the
encrypting drive — inside a tamper-evident box, and that split puts the strongest guarantee where
the sensitive data actually is.
STANDARD 1 GbE PORT · NO PRODUCT SELECTED
Component G · Egress
Management interface
A separate network port, on a separate network, used to send measurements
back to PRAQTOR QUANTUM and to report device health.
Port · 1 × 1 GbE copper, out-of-band
Carries · Measurement records, health, status · Never · packets, payload, raw capture
Destinations · Fixed and auditable — the customer can enforce it at their own boundary
Link loss · Measurements buffer locally on encrypted storage and forward when it returns
No vendor needed
Standard 1 GbE copper network interface
Ordinary, commodity, and deliberately so. The measurement
volume is small, the destination list is short, and there is nothing about this interface that benefits
from a specialist part. What matters here is not the hardware but the policy: which destinations it may
contact, and the fact that it is the sensor’s only transmitting interface.
Why it mattersThis is the sensor's only transmitting interface,
and it is never on the monitored network. That separation is what lets a network owner say yes:
whatever happens on the management side, nothing can travel back toward production, because the
capture side has no path to send on.
Inside the device
Where everything sits
A top-down view of the 1U configuration. Traffic enters at the left on the receive-only capture
interface, is reduced almost immediately, and leaves as measurements on the management port at the right.
◀ SCROLL HORIZONTALLY IF TRUNCATED ▶
Fig. 2 — Component layout, 1U configuration.
Physical specifications
Target form factor
Every entry below is a design intent to be validated by future engineering work — not a measured
figure, not a committed specification, and not a product datasheet.
Why there are no performance numbers here
An earlier version of this page published specific figures: handshakes per second, wattage, weight,
capacity, temperature range. None of them had been benchmarked, and they have been removed.
Publishing precise numbers for hardware that has not been built creates false precision, and the honest
answer to "how did you establish that figure?" was "we have not measured it."
Figures will be published once a prototype has been measured against real traffic — not before.
Parameter
1U rack configuration
Compact fanless configuration
Form factor
19" rack-mount, 1U
Desktop / shelf, fanless sealed enclosure
Dimensions
Standard 1U rack envelope
Compact desktop / shelf envelope
Weight
Rack and desktop class respectively — to be established on build
Cooling
Passive — no fans, no filters
Passive — sealed
Power
Low-power appliance target; single or redundant PSU
1 × 1 GbE copper, out-of-band — the only transmitting interface
Capture plane
Sized to sustain the monitored segment's packet rate at line speed
Analysis plane
Performance sized and benchmarked to the deployment traffic profile — no figure is published until a prototype has been measured
Storage
Self-encrypting NVMe with pre-boot authentication. Capacity is set by the detailed-window retention policy, not by traffic volume, and is sized on benchmark
Retention
Policy-controlled. Detailed observations retained briefly; long-term reporting uses aggregated cryptographic measurements rather than raw per-connection records
Operating temperature
Commercial and industrial-temperature configurations envisioned
Platform integrity
Signed and measured boot; firmware protect, detect and recover
Tamper
Tamper-evident chassis with intrusion detection reported to the platform
Sourcing intent
US-manufactured components where available; TAA-compliant throughout. Encrypted storage must carry an active FIPS 140-3 validation at the time of procurement — no part is pre-selected
What it stores
Parsed handshake metadata only — never payload, never raw packets
Deployment options
TAP or SPAN
Your network team will ask which one we need. Both work. They are not equivalent, and the difference
is worth a minute before you choose.
A network TAP
A TAP is a small piece of hardware inserted into a network cable. Traffic passes through it normally,
and it copies everything going past out to a separate monitor port. In a data-diode TAP there is
no physical connection between the monitor port and the network ports — data can travel to the
monitor port and cannot travel back, because there is no wire going the other way.
An auditor can verify that by looking at the device. The trade-off is that inserting a
TAP briefly interrupts the link, so it needs a maintenance window.
A switch SPAN port
A SPAN or mirror port is a feature of the switch you already own. The switch is configured to send a
copy of selected traffic to a monitor port. No cabling change, no maintenance window — a configuration
change only. The trade-offs are real: the link between switch and sensor is an
ordinary two-way Ethernet link, and on copper it cannot be made physically one-way
because a gigabit link needs both ends signalling or it will not come up at all. A SPAN port can also
drop traffic under switch load, and a dropped handshake is a measurement that never
happens.
◀ SCROLL HORIZONTALLY IF TRUNCATED ▶
Fig. 3 — Deployment options compared.
Data-diode / optical TAP
Copper switch SPAN port
One-way?
Physically. No return path exists.
By configuration. The link is electrically two-way.
Auditor can verify?
Yes, by inspection.
Only by reviewing switch configuration.
Drops traffic?
Not subject to SPAN oversubscription — but end-to-end capture still depends on monitor-link and sensor capacity.
Possibly, under switch load, in addition to the above.
Install effort
Brief link interruption to insert.
Configuration change only.
We call it
The assurance configuration.
The convenience configuration.
How we state it
Both are supported. Only the TAP configuration earns the phrase “auditable by
inspection.” Any deployment record states which one is in use, so nobody later mistakes
a configuration property for a physical one.
Build options
Three tiers: start simple, scale with results
Each tier is a complete way to collect the measurement. They differ in the strength of the guarantees
and in the effort to deploy — not in whether the enhanced report is possible.
Tier 1 — Virtual sensor
This is version one · software only · no hardware
A container or virtual machine on customer-provided hardware, receiving mirrored traffic from a
switch SPAN port. Nothing is shipped, nothing is procured.
Gets us — the measurement, quickly. Ideal for a first engagement, a
proof of value, or a customer who wants to see what the enhanced report looks like before committing
to anything physical.
Does not get us — any physical guarantee. Receive-only is a
configuration property. Capture fidelity depends on the host and the switch. Storage encryption
depends on whatever the customer already runs.
Tier 2 — Basic hardware
Commodity appliance + TAP
A commodity fanless appliance with a dedicated capture interface, deployed behind a real network
TAP rather than a SPAN port, with encrypted local storage and a separate management interface.
Gets us — a TAP in the path, dedicated capture hardware not competing
with other workloads, encrypted storage, and a much stronger conversation with the customer's
security team. Materially better capture fidelity.
Does not get us — tamper evidence, a verified boot chain, or a
controlled supply chain.
Tier 3 — Purpose-built appliance
US-sourced · tamper-evident
A US-sourced build in a tamper-evident enclosure: data-diode TAP, physically receive-only optical
capture interface, validated self-encrypting storage, signed and measured boot, chassis intrusion
detection, and firmware protect / detect / recover.
Gets us — a configuration designed to support the stronger assurance
requirements commonly encountered in defense, federal and operational-technology environments, where
the network owner's question is not “is it configured to be passive” but “can it
transmit at all” — and the answer is verifiable by inspection.
A secure hardware design is necessary but not
sufficient for deployment in those environments. Authorization also involves system hardening,
vulnerability management, supply-chain review, configuration approval, electromagnetic compatibility
and customer-specific security controls. The hardware supports that process; it does not complete it.
Costs us — procurement lead time, integration effort, and per-unit
cost.
Start at Tier 1 to prove the report is better. Move up only where the
customer's environment demands it.
FUTURE VISION — NOT AVAILABLE TODAY — REQUIRES FURTHER RESEARCH
This section describes a concept under exploration, not a product or roadmap commitment.
No hardware has been designed, built, procured or tested. Component categories are illustrative; no
vendor, part or model has been selected, and every specification shown is a design intent to be
validated by future engineering work.
 perfectron.com — ROC254A ↗